Public software multiples have dropped in the past 12 months, as AI threatens the obsolescence of SaaS models. The median SaaS company in the universe of publicly traded SaaS names that we have analyzed traded at 17.6x forward revenue at the 2021 peak. Today it trades at 2.8x — an 84% compression, and well below the 8.0x floor that held through the entire pre-COVID era.
Meanwhile all things AI are traded at astronomical levels. AI is software after all. It's important to recognized that all software firms are no not SaaS with its distinguishing characteristics and business model and just as importantly, all SaaS companies are not the same.
The public software selloff only looks indiscriminate from a distance. Up close it's telling a story — the market is repricing, with real conviction, which kind of software survives the transition with AI. And the dividing line isn't size, or growth, or profitability. It's whether the product sits on defensible, domain-specific ground, and whether it's a thin horizontal layer that emerging AI systems can easily replicate and improve upon.
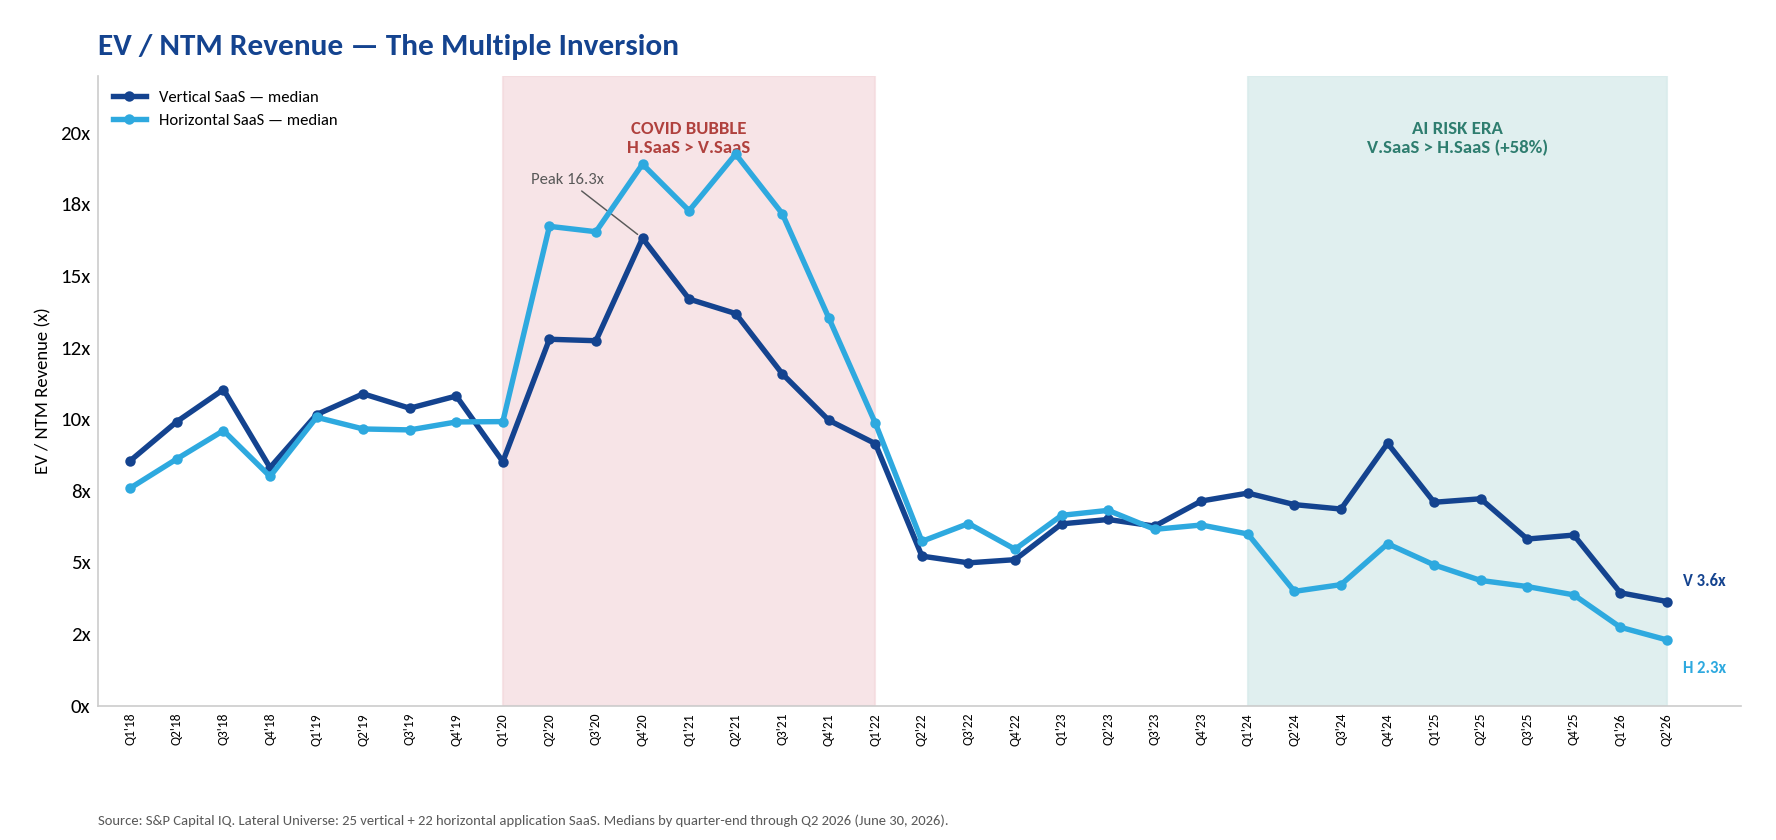
Vertical vs Horizontal SaaS, median EV/NTM revenue, Q1 2018–June 2026 (S&P Capital IQ; Lateral). As of June 30, 2026.
This is the first in a series on that divide. It begins with a fact that would have sounded absurd three years ago.
The market now pays a 58% premium for vertical SaaS over horizontal — and during COVID it was the exact opposite.
The tell-tale inversion of vertical over horizonal
For most of the last decade the market favored software companies with the broadest applicability and the very largest total available markets. Horizontal platforms — Salesforce, Workday, HubSpot — carried the richest multiples because every company needed them: sell one product that applies to every industry, amortize R&D across an enormous base, with no apparent growth ceiling. Vertical software, highly specialized and confined to a single industry segment, traded at a discount and was seen as niche or limited. At the COVID peak the gap was extreme — horizontal names commanded a premium of 50%, indicating the market was willing to pay up for TAM optionality and hypergrowth.
That relationship has flipped. As of June 2026, vertical SaaS trades at a 58% premium on forward revenue (3.6x vs. 2.3x median) and a 64% premium on forward EBITDA. The crossover happened in late 2023, and the spread has stayed wide since — peaking at +76% in mid-2024 and holding +58% today. The COVID growth bubble regime in software multiples has given way to the AI risk era.
What's striking is how the inversion happened. It wasn't that vertical names rallied — rather, software stocks all fell and everyone got cheaper. Horizontal software stocks fell harder. From its 2021 peak the horizontal software median collapsed 88% (19.3x to 2.3x). Vertical compressed too, but only 78% (16.3x to 3.6x). That relative resilience — a few extra turns held through the worst repricing in a decade — is the entire premium. The market didn't reward vertical software so much as it punished horizontal more. And it is still happening: in the single quarter from March to June 2026, horizontal forward multiples fell another 16% while vertical fell 8%, pushing the premium from 44% to 58% in three months.
Same starting line, different finish
One way to illustrate this dynamic is to compare a specific pair. In 2018 Guidewire and Five9 traded at virtually the same multiple — about 10.9x revenue. Guidewire is vertically focused on the insurance industry with a suite of SaaS products for property-and-casualty insurance underwriting; its software is the system of record for how carriers price and book risk. Five9 runs horizontally focused cloud call-center software for any industry. Call center software is vulnerable to AI chatbots and customer service systems. As of March 31, 2026, Guidewire trades at 8.1x revenue, down just 24%. Five9 trades at 1.0x revenue, down 91%.
Same starting multiple, opposite fates. The difference is that a carrier cannot rip Guidewire out of its underwriting stack without re-plumbing the business — while AI voice agents are directly, visibly substituting for exactly what Five9 sells. The same split runs through the whole universe. Veeva and Tyler, embedded in FDA-regulated life-sciences and government workflows, have held 5–6x revenues, as of June 30, 2026. HubSpot and Atlassian, horizontal productivity layers, have collapsed to 2–3x. Of the vertical names, 14 of 25 have re-rated higher relative to the group; of the horizontal names, zero did.
Durability, rather than growth
One objection to this thesis is that it is a growth story dressed up as an overreaction to AI risk — vertical names simply grow faster, so of course they trade up. Vertical does grow faster, but only modestly: 14.0% versus 11.1% median, a 2.8-point edge — nowhere near enough to explain a 58% multiple premium. The more telling number is what the market pays per unit of growth. Normalize the multiple by growth rate and vertical still commands 1.4x more: 0.32x of forward revenue per point of growth, against 0.23x for horizontal. At every growth rate across the cross-section, vertical trades two to four turns higher. The premium isn't growth. It's durability — the market's confidence that next year's revenue is still there, because the software is wired into a regulated, mission-critical workflow that doesn't get swapped out when a model gets cheaper.
That's the asymmetry at the heart of the AI repricing. Horizontal platforms face direct substitution from Copilot, Gemini, and AI-native startups attacking generic workflows. Vertical platforms — protected by domain complexity, regulatory requirements, proprietary data, and customer trust — are more structurally defensible. The market has simply started paying for that insulation — and as horizontal keeps declining faster, the revenue premium has pushed out to 58%, with vertical carrying a ~64% forward-EBITDA premium. We believe this repricing still has room to run and we will be watching it closely in future posts.
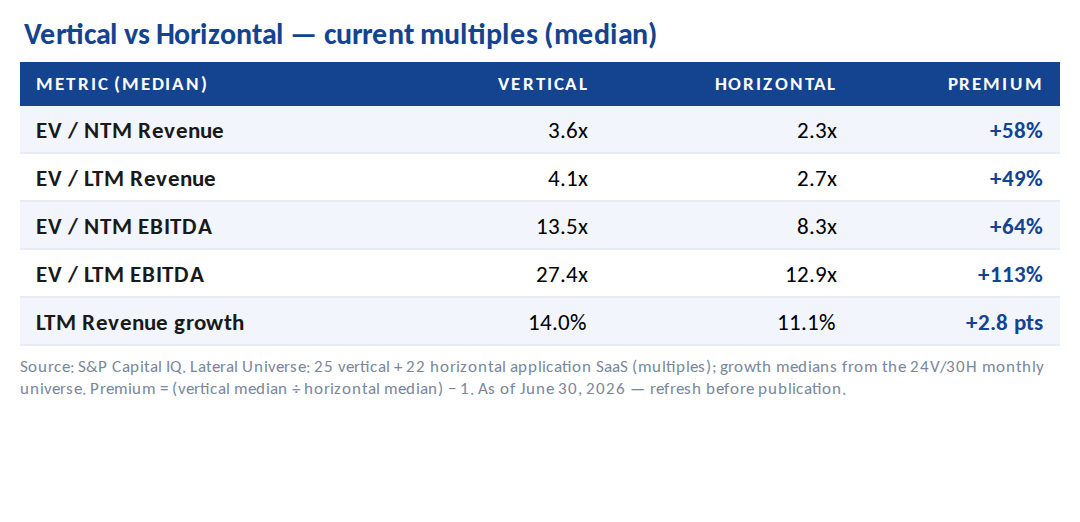
Vertical vs Horizontal — current multiples (median). As of June 30, 2026.
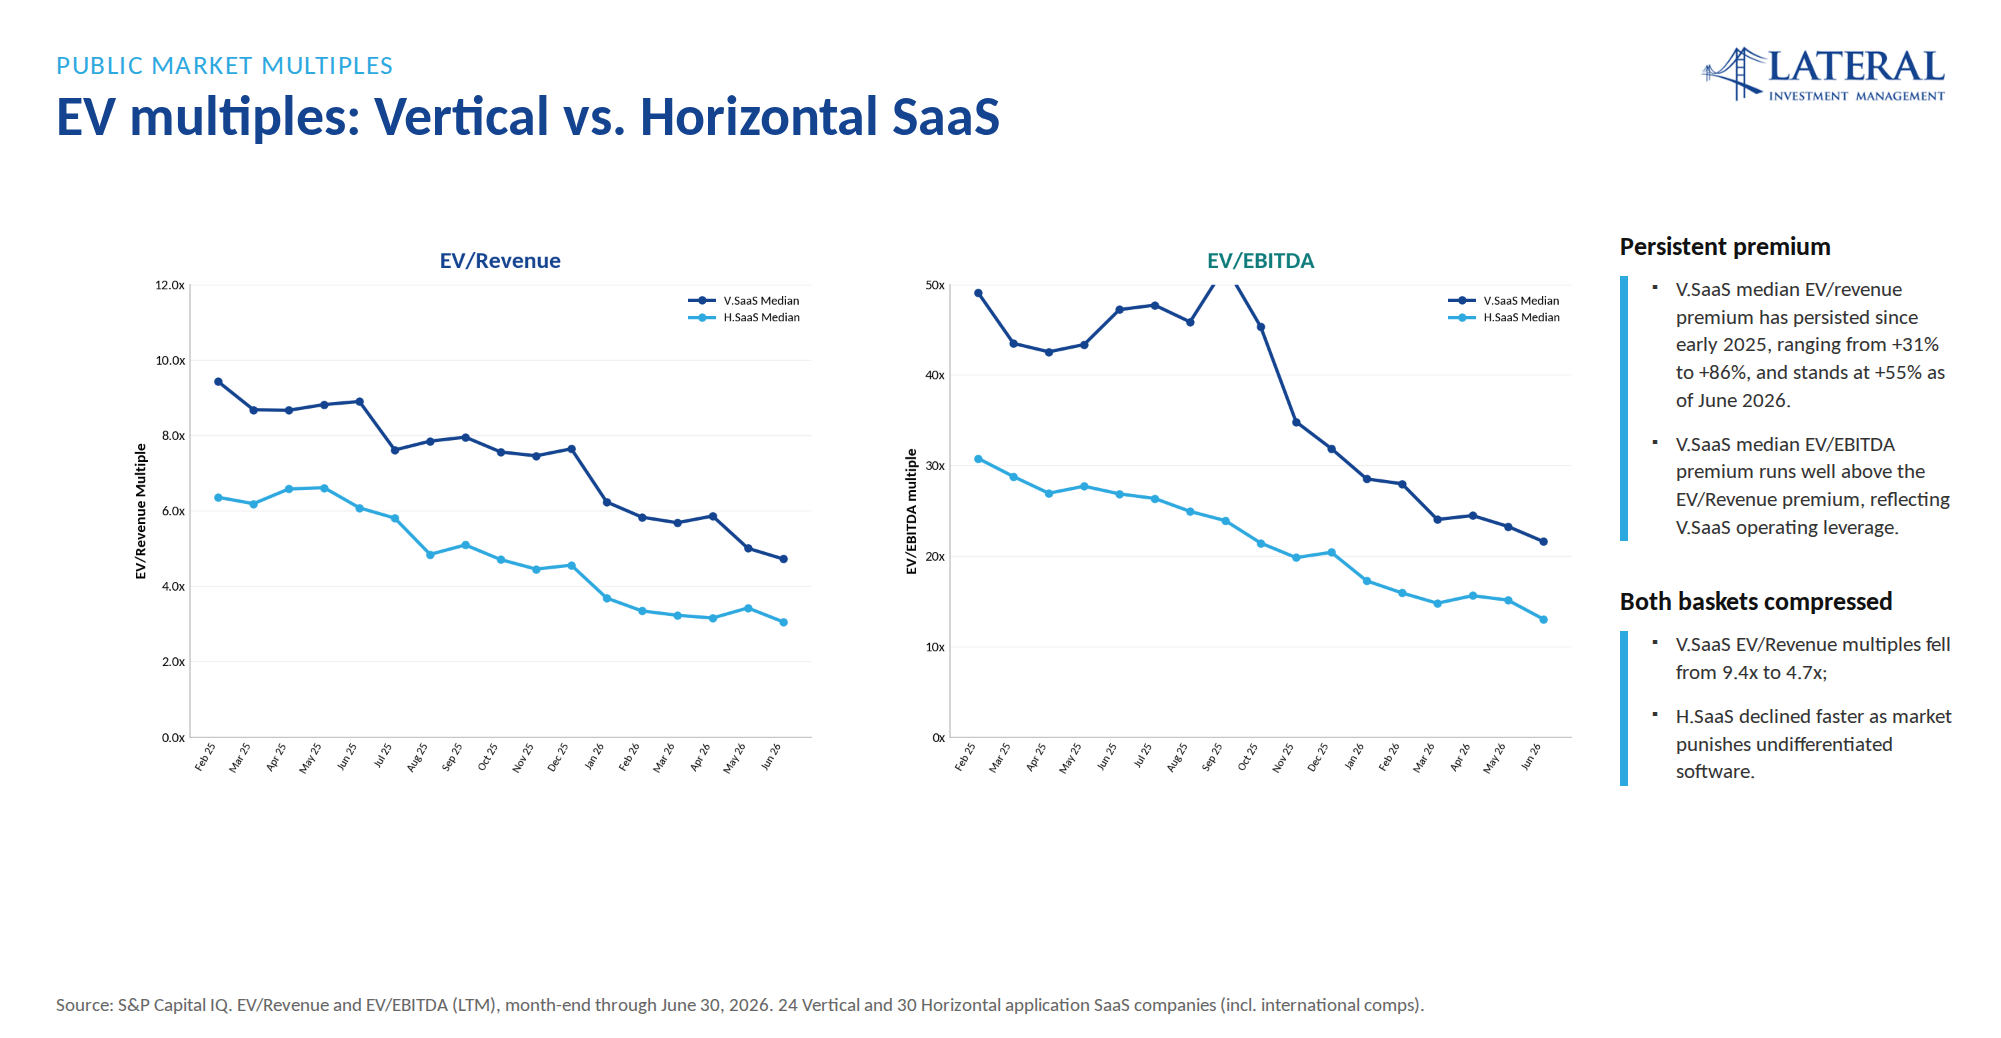
Vertical vs Horizontal median EV/Revenue and EV/EBITDA, monthly (Lateral). As of June 30, 2026.
On June 30, 2026, the vertical/horizontal forward valuation premium, at +58%, sits below its Q2 2024 peak of +76% but holds the wide end of its range. On a trailing basis the EBITDA gap is wider still: vertical commands a +49% premium on EV/LTM revenue (4.1x vs. 2.7x) and +113% on EV/LTM EBITDA (27.4x vs. 12.9x).